A Java debugger for Visual Studio 2012 (and 2010)
Tunnel Vision Labs is currently working on extending the Java Language Support extension for Visual Studio to include a complete source-level debugger. If you are interested in testing an alpha build of this debugger, please contact Tunnel Vision Labs for more information.
In this post, I’ll talk a bit about the current state of the extension and the features currently supported by the debugger.
Current features of the debugger include:
- Support for multiple JVMs
- Support for the 32- and 64-bit releases of the standard JDK 6 and 7 (HotSpot VM)
- Support for the 32- and 64-bit releases of JRockit R28.x
- Full support for “Java Runtime Environment” exceptions in the Debug → Exceptions dialog
- Standard packages and exceptions are shown in the Java Runtime Environment category
- Users can add their own exceptions by name
- Users may select which exceptions the debugger should break on at the time they are thrown
- Unhandled exceptions automatically trigger a breakpoint
- When an exception is thrown, a message is printed to the output window (similar to the way it’s handled in C# debugging)
- Standard (unconditional) breakpoints
- Stepping in the editor
- Step Into/Over/Out
- The Step Over command steps over a statement – with proper support for multiple statements on a single line
- Disassembly window
- Shows JVM bytecode interleaved with the original source code
- The Step Over command steps by bytecode instruction instead of by statement
- Support for the Locals, Autos, and Watch windows
- Support for the Immediate window
- Support for pinnable data tips
- Support for the Threads window
- Support for user-friendly representation of collections (lists, maps, arrays, etc.)
Stepping over statements
In our opinion, this is hands-down the coolest feature of our debugger.
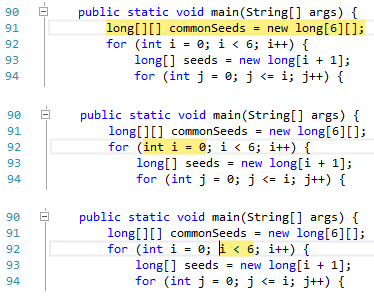
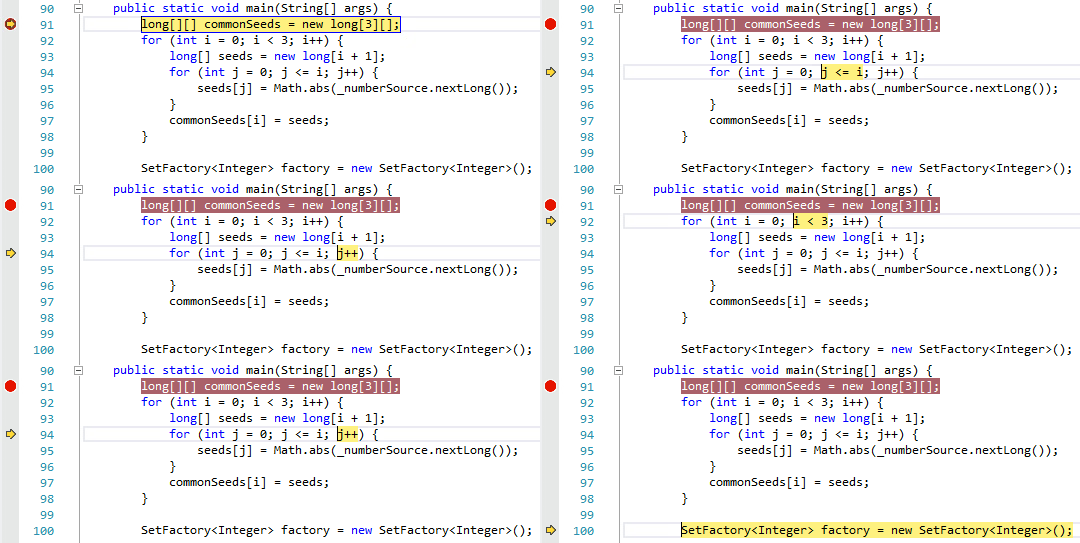
We’ve been looking, but so far it seems that no current Java IDE can properly distinguish between multiple statements on a single line. We aim to change that. The image below shows a series of steps in the debugger (the Step Over command was executed exactly one time between each image). As you can see, our debugger follows the logical stepping sequence from the initializer to the condition of the for statement.
Here is an animated image showing a more complete example.
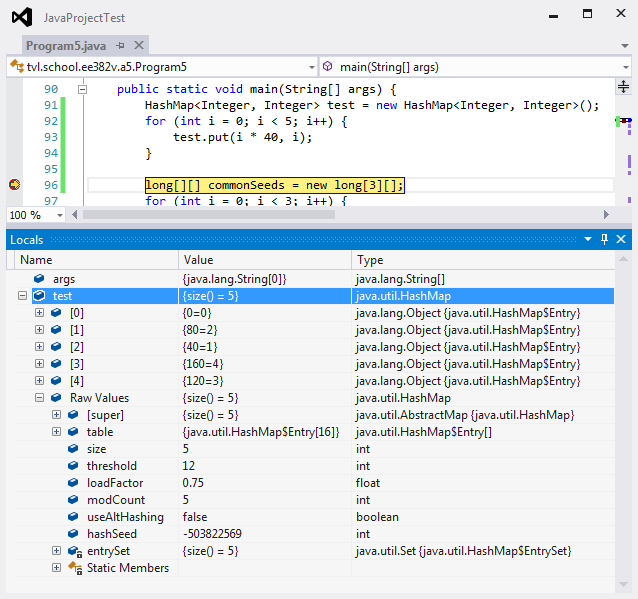
Intuitive display of collections without hiding data
The debugger provides special handling for arrays and classes implementing Collection, Map, and a few other interfaces. To ensure that the debugger doesn’t restrict access to information you need, a special Raw Values property is provided which the user can expand to see the object’s true internal structure. Direct access to the Static Members of classes is provided as well (standard for all classes).
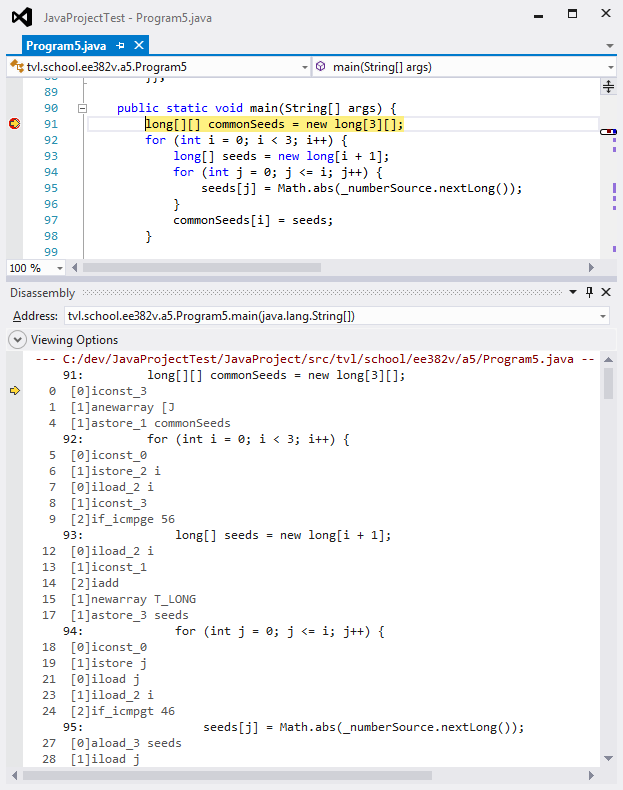
Bytecode disassembly
Curious about what your code is compiling to? The disassembly window fully supports Java bytecode while debugging your program.
Exceptions
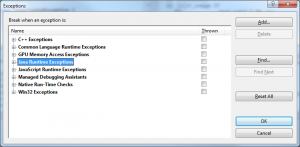
The Java debugger extends the Debug → Exceptions window with support for Java Runtime Environment exceptions.
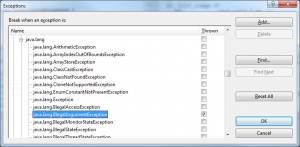
Handling behavior for exceptions may be configured by package or by individual exception type. The following example shows a user configuration requesting the debugger stop immediately when an IllegalArgumentException is thrown.
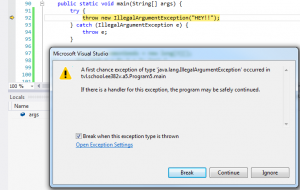
When an exception is thrown, the debugger first checks to see if the user has requested the debugger stop when the exception is thrown. In this case, we configured the debugger to stop when an IllegalArgumentException is thrown, whether or not a catch statement is available to handle the exception.
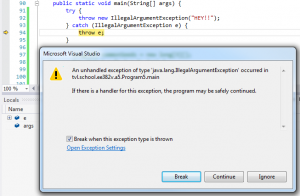
If an exception is thrown and no exception handler is available to handle the exception, the debugger stops immediately at the point the unhandled exception is thrown. The user does not need to specially configure the debugger to respond to this error case.
Debugger tool windows
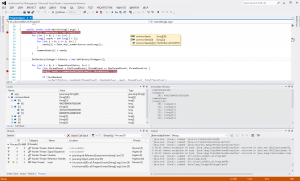
The following image shows the contents of many (but not all) of the currently supported debugger windows in Visual Studio.


You talk about “no current Java IDE can properly distinguish between multiple statements on a single line”. Is it even possible in visual c++ or c#. I use visual studio 2012 but i don’t see that feature in c++ atleast. (i use c# rarely)
April 16th, 2013 at 11:07 pmThe C# debugger does an excellent job with this. If you click in the left margin, it will toggle a breakpoint on the first statement on the line. However, if you use the Toggle Breakpoint keyboard shortcut or right click → Breakpoint → Insert Breakpoint, the breakpoint will be inserted at the statement actually under the caret.
April 19th, 2013 at 9:01 amI would really like this. Visual Studio is the best editor I’ve seen so far. And I don’t like eclipse. So having it work for Java would be huge!!! I’d pay $100 dlls for a personal version.
August 23rd, 2013 at 1:08 pmI am interested in testing an alpha build of this debugger, Java debugger for Visual Studio 2012 (and 2010). How can I access the down loader? Thanks Renato
September 2nd, 2013 at 9:19 amAny news about this debugger? I look forward, I hope will be ready soon.
October 5th, 2013 at 10:19 amIt would be nice to see if this is at least being worked on. I think it would be awesome to write Java code in Visual Studio.
November 9th, 2013 at 5:33 pm